アニメーションの作成
数値シミュレーションなどを行なう際に、解析結果をアニメーションとして表現すると現象を把握しやすくなることもあります。matplotlib.animationパッケージ には、データを動的に可視化するための ArtistAnimation() と FuncAnimation() が用意されています。
matplotlib.animation.ArtistAnimation()
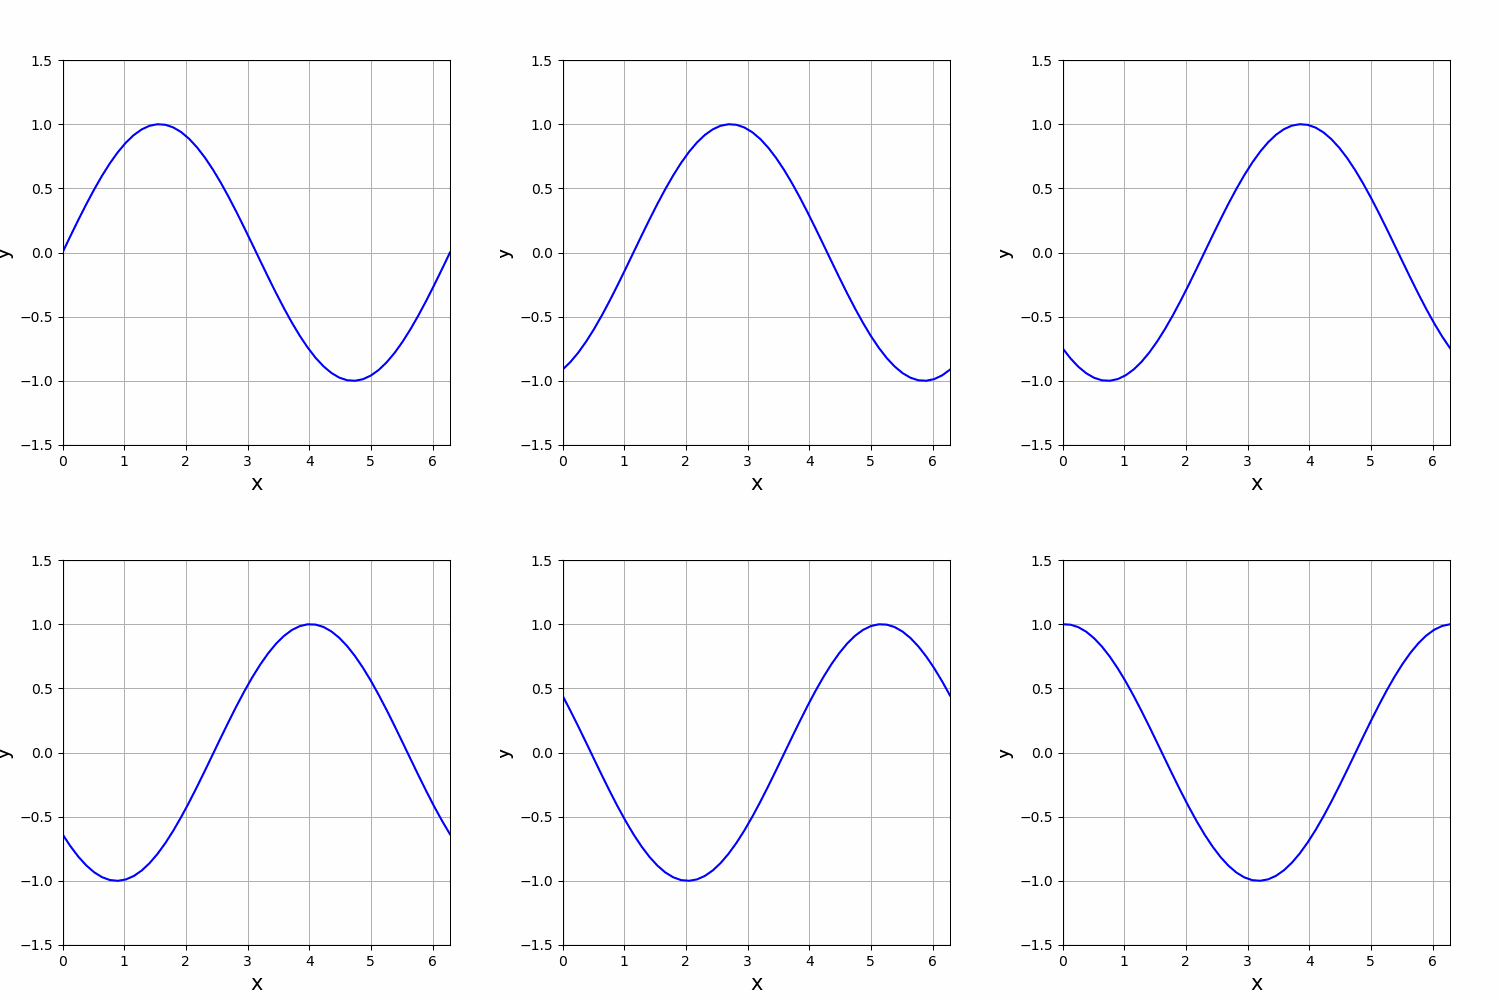
ArtistAnimation()関数でアニメーションを作成する場合は、予めすべてのプロットデータを渡すことになります。例として右方向に進む正弦波のアニメーションを表示させてみましょう。Jupyter Notebook でアニメーションを描画させるためには、%matplotlib nbagg というマジックコマンドが必要です(Google Colab では不要)。
# MATPLOTLIB_ANIMATION_01

%matplotlib nbagg  # Google Colabでは不要
import numpy as np
import matplotlib.pyplot as plt
from matplotlib import animation, rc

# FigureとAxes
fig = plt.figure(figsize = (5, 5))
ax = fig.add_subplot(111)
ax.grid()
ax.set_xlim(0, 2 * np.pi)
ax.set_ylim(-1.5, 1.5)
ax.set_xlabel("x", fontsize=15)
ax.set_ylabel("y", fontsize=15)

ims = []
x = np.linspace(0, 2*np.pi)

# サブプロットのリストを用意
for t in range(100):
    y = np.sin(x - t)
    artist = ax.plot(x, y, color="b")
    ims.append(artist)

# アニメーションを作成
ani = animation.ArtistAnimation(
      fig,  # Figureオブジェクト
      ims,  # サブプロット(Axes)のリスト
      interval=200,  # サブプロットの更新頻度(ms)
      blit = True  # blitting による処理の高速化
      )

plt.show()

'''Google Colab で実行する場合、plt.show() の代わりに以下のコードを追加
rc("animation", html="jshtml")
plt.close()
ani'''

コード PYTHON_MATPLOTLIB_ANIMATION_01 では for文を使って ims に Axesオブジェクトをまとめて 100個格納し、それを ArtistAnimation() に渡してアニメーションを表示しています。interval はサブプロットの更新間隔です。単位は ms (ミリ秒) なので、200 × 0.001 = 0.2 秒間隔に設定していることになります。
matplotlib.animation.FuncAnimation()
FuncAnimation() の第2引数には「グラフを描画する関数」を渡します。すなわち、FuncAnimation() は受け取った関数を逐次呼び出してサブプロット (Axes) を更新しながらアニメーションを表示します。ArtisitAnimation() に比べて柔軟性で勝りますが、処理負担は大きくなります。
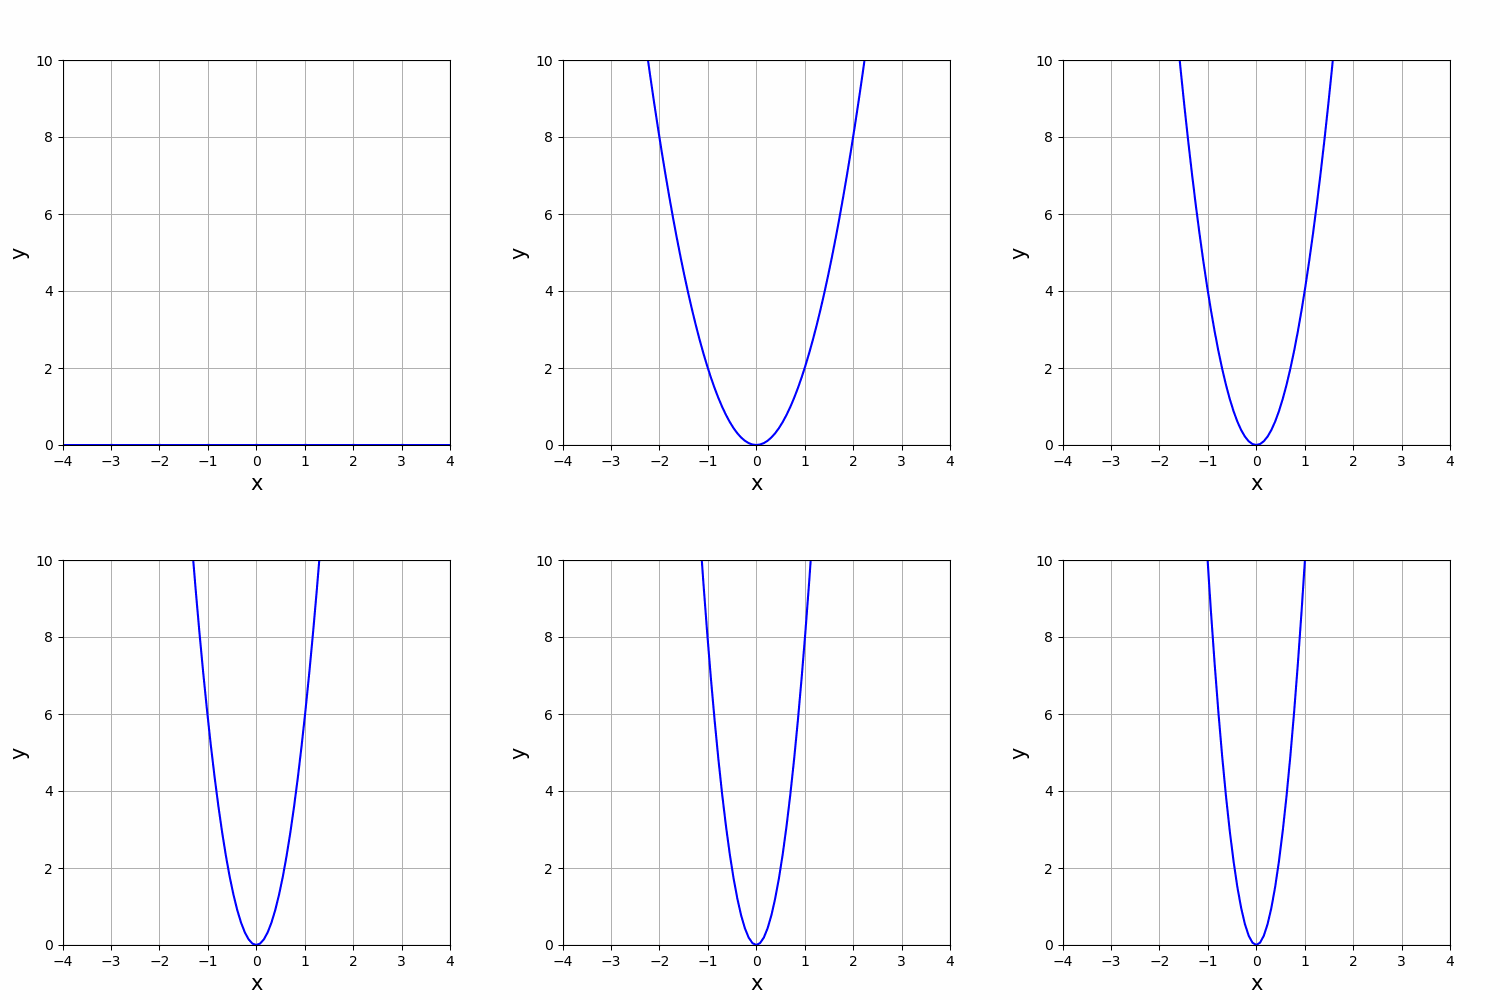
二次関数 $y=ax^2$ の係数 $a$ を変化させるグラフを描いてみます。
# MATPLOTLIB_ANIMATION_02

# In[1]

%matplotlib nbagg  # Google Colabでは不要
import numpy as np
import matplotlib.pyplot as plt
from matplotlib import animation, rc

fig, ax = plt.subplots(figsize = (5, 5))
ax.set_xlim(-4, 4)
ax.set_ylim(0, 10)
ax.set_xlabel("x", fontsize = 15)
ax.set_ylabel("y", fontsize = 15)
ax.grid()

line, = ax.plot([0], [0], 'b')

x = np.linspace(-5, 5, 129)

def update(a):
    y = a * x**2
    line.set_data(x, y)
    return line,

ani = animation.FuncAnimation(
      fig,  # Figureオブジェクト
      update,  # グラフ描画関数
      frames = np.arange(0, 10, 0.1),  # フレームを設定
      interval = 100,  # 更新間隔(ms)
      repeat = True,  # 描画を繰り返す
      blit = True  # blitting による処理の高速化
      )

ani.save('ani_update.gif', writer='pillow')
plt.show()

'''Google Colab で実行する場合、plt.show() の代わりに以下のコードを追加
rc("animation", html="jshtml")
plt.close()
ani'''

frames に渡した値は、グラフ描画関数の引数に渡されます。
コード PYTHON_MATPLOTLIB_ANIMATION_02-1 では update() の t に順次
t = 0, 0.1, 0.2, 0.3, …… 9.8, 9.9
を渡して座標 y を計算します。このように逐次データを更新しながらサブプロットを連続表示することでアニメーションを表現しますが、その更新間隔を決めるのが interval という引数です。単位は ms (ミリ秒) なので、100 × 0.001 = 0.1 秒毎にサブプロットを更新していることになります。
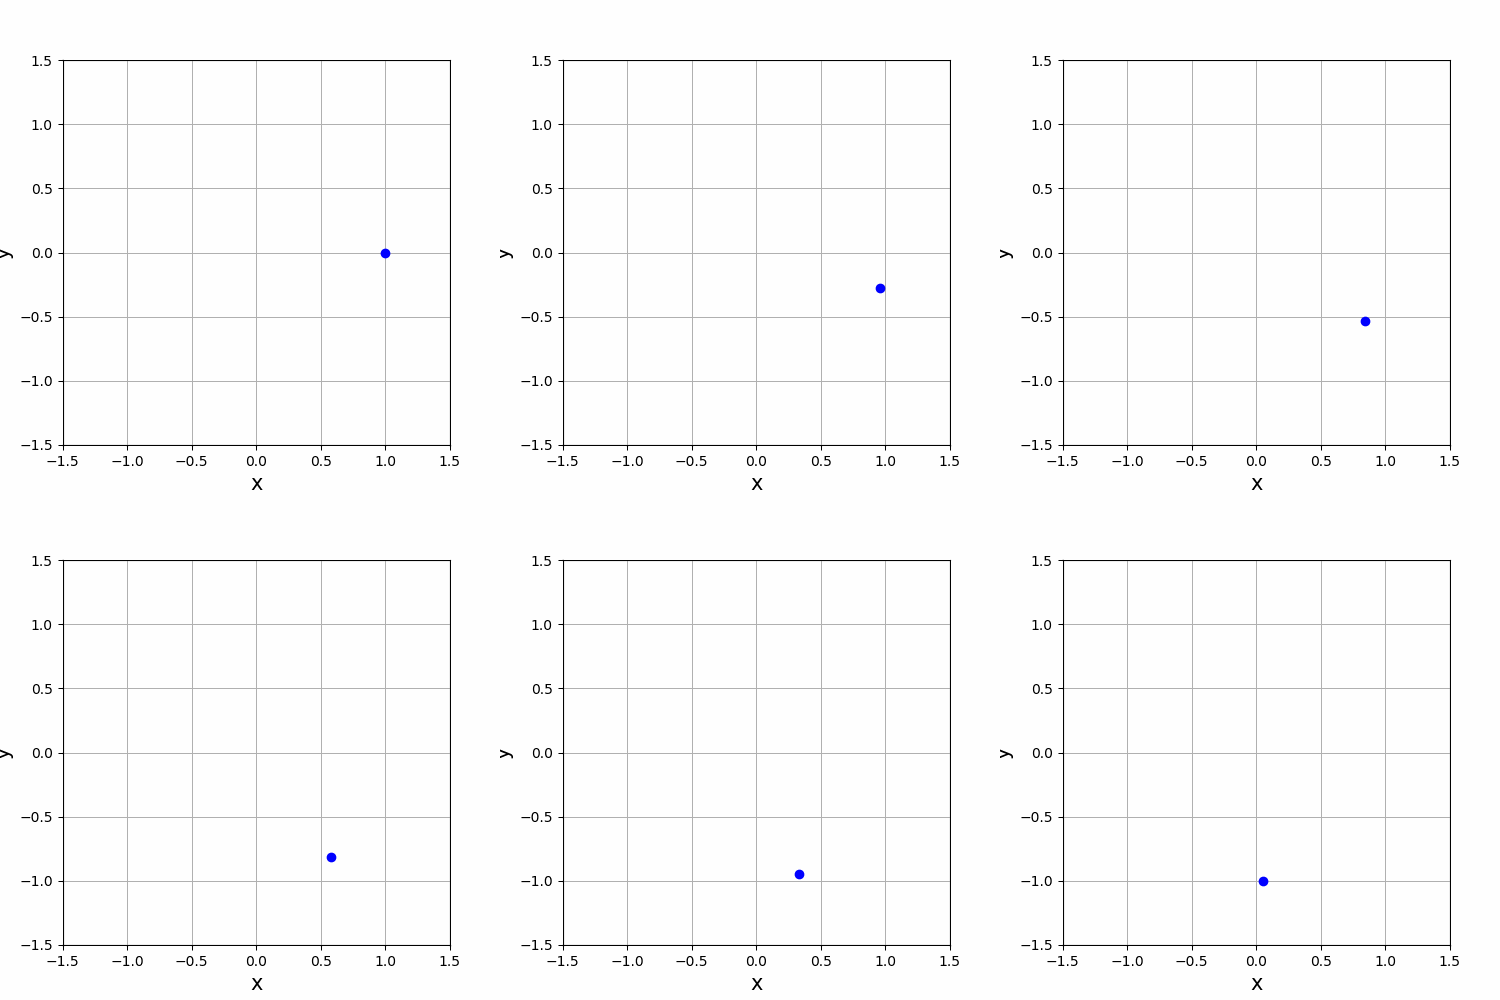
媒介変数方程式
\[x(t)=\cos t,\quad y(t)=\sin t\]
を使って円運動を表示するコードです。
#In[2]

# AxesとFigureを設定
fig, ax = plt.subplots(figsize = (5, 5))
ax.set_xlim(-1.5, 1.5)
ax.set_ylim(-1.5, 1.5)
ax.set_xlabel("x", fontsize = 15)
ax.set_ylabel("y", fontsize = 15)
ax.grid()

dot, = ax.plot([0], [0], 'bo')

def dot_circle(t):
    xt = np.cos(t)
    yt = np.sin(t)
    dot.set_data(xt, yt)
    return dot,

ani = animation.FuncAnimation(
      fig,  # Figureオブジェクト
      dot_circle,  # グラフ描画関数
      frames = np.arange(0, 30, 0.1),  # フレームを設定
      interval = 100,  # 更新間隔(ms)
      repeat = True,  # 描画を繰り返す
      blit = True  # blitting による処理の高速化
      )

'''Google Colab で実行する場合、plt.show() の代わりに以下のコードを追加
rc("animation", html="jshtml")
plt.close()
ani'''


コメント
下記は誤植と思われますので、ご確認ください。
In[1]プログラムの update( ) 関数で、最後に ret line, を追加する。
Google Colab で今回のアニメーションを再現するためにいろいろ試した結果、今の段階で以下が一応の結論になりました。あっても特に問題ないが、%matplotlib nbagg は不要。最後のplt.show( ) の代わりに以下の3行を追加。
rc(“animation”, html = “jshtml”)
plt.close()
ani
ret line, は return line, の間違いでした。訂正します。
貴重な情報ありがとうございます!
Google Colab でも実行できるように、記事内のコードを補足しておきました。