目盛と目盛ラベルの設定
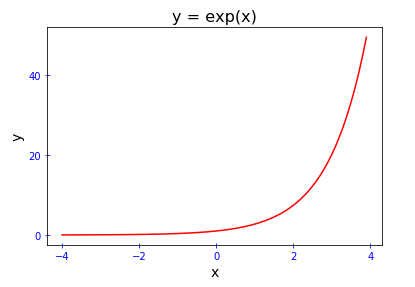
Axes.set_xticks(), Axes.set_yticks()メソッドの引数に数値のリストを渡すと、x 軸と y 軸の要素の位置に目盛と要素が表示されます。
# MATPLOTLIB_AXES_SET_TICKS

# In[1]

# 必要なモジュールをインポート
import numpy as np
import matplotlib.pyplot as plt

# Figureを設定
fig = plt.figure()

# Axesを追加
ax = fig.add_subplot(111)

# xのデータを作成
x = np.arange(-4, 4, 0.1)

# y = exp(x)
y = np.exp(x)

# Axesのタイトルの設定
ax.set_title("y = exp(x)", fontsize = 16)

# 軸ラベルの設定
ax.set_xlabel("x", size = 14, weight = "light")
ax.set_ylabel("y", size = 14, weight = "light")

# x軸の目盛設定
ax.set_xticks([-4, -2, 0, 2, 4])

# y軸の目盛設定
ax.set_yticks([0, 20, 40])

# 目盛方向を両側に設定
# 目盛の長さを5ポイントに設定
# 目盛と目盛ラベルの色をblueに設定
ax.tick_params(direction = "inout", length = 5, colors = "blue")

# データをプロット
ax.plot(x, y, color = "red")

Axes.tick_params() で目盛の書式を設定することができます。
このメソッドの主な引数を表にまとめておきます。
| tick_params()の引数 | 説明 |
|---|---|
| axis | 目盛を設定する軸 {‘x’ (x軸), ‘y’ (y軸), ‘both’ (両軸)} |
| which | 主目盛と補助目盛の選択 {‘major’ (主目盛), ‘minor’ (補助目盛), ‘both’ (両目盛)} |
| direction | 目盛の方向 {‘in’ (内側), ‘out (外側)’, ‘inout’ (両側)} |
| length | 目盛の長さ {float} |
| width | 目盛の幅 {float} |
| color | 目盛の色 {color} |
| pad | 目盛と目盛ラベルの距離 {float} |
| labelsize | 目盛ラベルのサイズ {float or str} |
| labelcolor | 目盛ラベルの色 {color} |
| colors | 目盛と目盛ラベルの色 {color} |
| bottom | 下軸目盛 {bool} |
| top | 上軸目盛 {bool} |
| left | 左軸目盛 {bool} |
| right | 右軸目盛 {bool} |
| labelbottom | 下軸ラベル {bool} |
| labeltop | 上軸ラベル {bool} |
| labelleft | 左軸ラベル {bool} |
| labelright | 右軸ラベル {bool} |
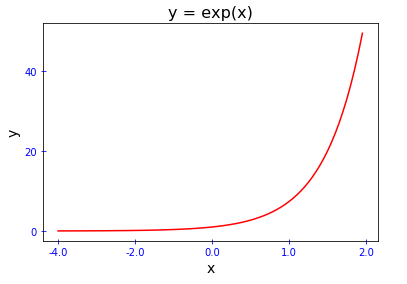
デフォルトでは、Axes.set_xticks(), Axes.set_yticks() に渡したリストの各要素が目盛ラベルとして表示されますが、Axes.set_xticklabels(), Axes.set_yticklabels()メソッドを使って目盛ラベルを上書きすることができます。たとえば上のサンプルコードに
# x軸の目盛ラベルの上書き
ax.set_xticklabels([-4.0, -2.0, 0.0, 1.0, 2.0])
というコードを追加すると、x 軸の目盛ラベルが上書きされて下図のようになります。

また、引数に空白のリストを渡すと目盛ラベルを削除することができます。
目盛線の設定
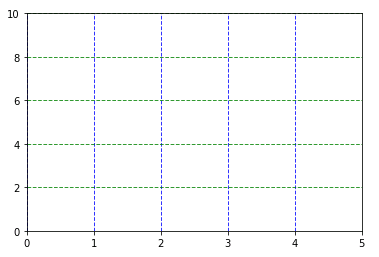
Axes.grid() で 目盛線 を設定することもできます。
# MATPLOTLIB_AXES_GRID

# モジュールをインポート
import matplotlib.pyplot as plt

# Figureを設定
fig = plt.figure()

# Axesを追加
ax = fig.add_subplot(111)

# 軸の範囲を設定
ax.set_xlim(0, 5)
ax.set_ylim(0, 10)

# x軸に補助目盛線を設定
ax.grid(which = "major", axis = "x", color = "blue", alpha = 0.8,
        linestyle = "--", linewidth = 1)

# y軸に目盛線を設定
ax.grid(which = "major", axis = "y", color = "green", alpha = 0.8,
        linestyle = "--", linewidth = 1)

Axes.grid() の引数を掲載しておきます。
| Axes.grid()の引数 | 説明 |
|---|---|
| which | 主目盛線と補助目盛線の選択 {‘major’ (主目盛線), ‘minor’ (補助目盛線), ‘both’ (両目盛)} |
| axis | 目盛を設定する軸 {‘x’ (x軸), ‘y’ (y軸), ‘both’ (両軸)} |
| color | 目盛線の色 {color} |
| alpha | 目盛線の透明度 {float} |
| linewidth | 目盛線の幅 {float} |
| linestyle | 目盛線のスタイル {string} |
コメント
下記は誤植と思われますので、ご確認ください。
「x軸の目盛ラベルの上書き」コードの上と下の説明文で、
各要素がラベルとして → 各要素が目盛ラベルとして
Axes.set_xlabels( ), Axes.set_ylabels( ) → Axes.set_xticklabels( ), Axes.set_yticklabels( )
x 軸のラベルが上書き → x 軸の目盛ラベルが上書き
ラベルを削除する → 目盛ラベルを削除する
この記事は誤植が多すぎましたね …
すべて直しておきました。
ありがとうございます。m(_ _)m