【Matplotlib】線の種類(linestyle)
Matplotlib の Axes.plot()メソッドで描く線の種類は linestyle オプションで設定できます。
文字列による線種の指定
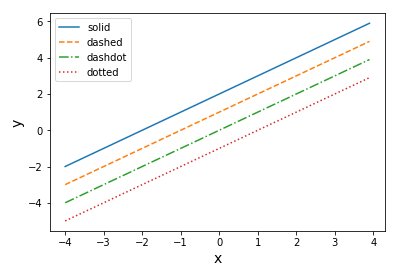
1つの方法として、linestyle に “solid”, “dashed”, “dashdot”, “dotted” などの文字列を渡して線の種類を決定します。
# PYTHON_MATPLOTLIB_LINESTYLE_01

# 必要なモジュールをインポート
import numpy as np
import matplotlib.pyplot as plt

# Figureを設定
fig = plt.figure()

# Axesを追加
ax = fig.add_subplot(111)

# x,yのデータを作成
x = np.arange(-4, 4, 0.1)
y = x

# 軸ラベルの設定
ax.set_xlabel("x", size = 14)
ax.set_ylabel("y", size = 14)

# 線の種類を指定してデータをプロット
ax.plot(x, y + 2, linestyle = "solid", label = "solid")
ax.plot(x, y + 1, linestyle = "dashed", label = "dashed")
ax.plot(x, y, linestyle = "dashdot", label = "dashdot")
ax.plot(x, y - 1, linestyle = "dotted", label = "dotted")

# 凡例の設定
ax.legend()
記号による線種の指定
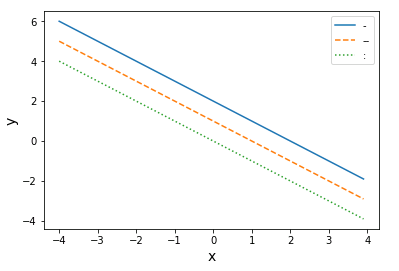
linestyle に “-“, “–“, “:” などの記号を指定する方法もあります。
# PYTHON_MATPLOTLIB_LINESTYLE_02

# Figureを設定
fig = plt.figure()

# Axesを追加
ax = fig.add_subplot(111)

# x,yのデータを作成
x = np.arange(-4, 4, 0.1)
y = -x

# 軸ラベルの設定
ax.set_xlabel("x", size = 14)
ax.set_ylabel("y", size = 14)

# 線の種類を指定してデータをプロット
ax.plot(x, y + 2, linestyle = "-", label = "-")
ax.plot(x, y + 1, linestyle = "--", label = "--")
ax.plot(x, y, linestyle = ":", label = ":")

# 凡例の設定
ax.legend()
【Matplotlib】線の太さと色、透明度(linewidth, color, alpha)
Axes.plot()メソッドの linewidth, color, alpha オプションで描く線の太さ、色、透明度(透過率)を設定できます。
線の太さ(linewidth)
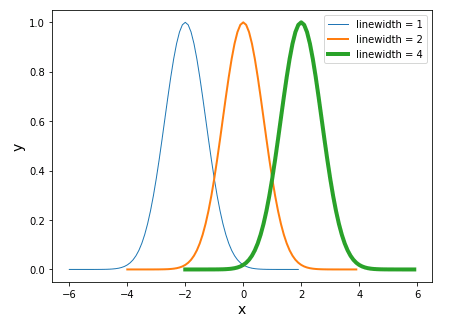
線の太さは linewidth オプションで指定します。
# PYTHON_MATPLOTLIB_LINESTYLE_03

import numpy as np
import matplotlib.pyplot as plt

# Figureを設定
fig = plt.figure(figsize = (6.8, 5))

# Axesを追加
ax = fig.add_subplot(111)

# x,yのデータを作成
x = np.arange(-4, 4, 0.1)
y = np.exp(-x**2)

# 軸ラベルの設定
ax.set_xlabel("x", size = 14)
ax.set_ylabel("y", size = 14)

# 線の太さを指定してデータをプロット
ax.plot(x - 2, y, linewidth = 1, label = "linewidth = 1")
ax.plot(x, y, linewidth = 2, label = "linewidth = 2")
ax.plot(x + 2, y, linewidth = 4, label = "linewidth = 4")

# 凡例の設定
ax.legend()
線の色と透明度(color, alpha)
線の色は color, 透明度(透過率)は alpha オプションで指定します。
# PYTHON_MATPLOTLIB_LINESTYLE_04

import numpy as np
import matplotlib.pyplot as plt

# Figureを設定
fig = plt.figure(figsize = (6, 4))

# Axesを追加
ax = fig.add_subplot(111)

# x,yのデータを作成
x = np.arange(-4, 4, 0.1)
y = np.exp(-x**2)

# 軸ラベルの設定
ax.set_xlabel("x", size = 14)
ax.set_ylabel("y", size = 14)

# 色と透明度を指定してデータをプロット
ax.plot(x - 2, y, color = "crimson", alpha = 1.0,
        label = "crimson, alpha = 1.0")

ax.plot(x, y, color = "darkblue", alpha = 0.6,
        label = "darkblue, alpha = 0.6")

ax.plot(x + 2, y, color = "black", alpha = 0.2,
        label = "black, alpha = 0.2")

# 凡例の設定
ax.legend(bbox_to_anchor = (0.45, 1.3))
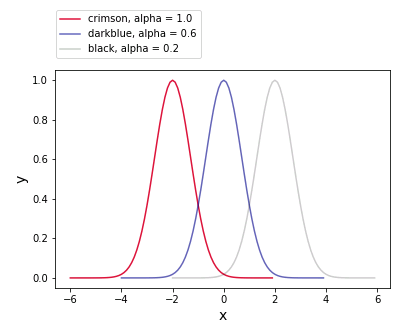
[注] 凡例を Axes の外側に配置するために、Axes.legend()メソッドの bbox_to_anchor オプションを使用しています。
コメント