注釈と矢印
グラフのある特定の位置を明示するために、Axes.annotate() を使って注釈 (annotation)と矢印 (arrow) を表示することができます。まずは簡単な例を示します。
# MATPLOTLIB_ANNOTATE

# In[1]

import numpy as np
import matplotlib.pyplot as plt

# FigureとAxesを描画
fig, ax = plt.subplots(figsize=(5, 5))
ax.grid()
ax.set_xlim(0, 10)
ax.set_ylim(0, 10)

# 指定した位置に注釈(annotation)を入れる
ax.annotate("point A", xy=(4, 4), size=15, color="red")

plt.show()
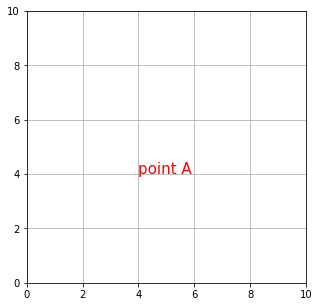
このように、Axes.annotate() は注釈テキストを表示するためのメソッドなので、size や color などに渡した値はテキストに対して適用されます。矢印は arrowprops というオプション引数に dict() を渡すと表示されます (dict() の中身は空白でも構いません) 。xy は指し示したい点の座標を表す引数なので、特に何も指定しなければ、矢印は先端部分だけが表示されます。
# In[2]

fig, ax = plt.subplots(figsize=(5, 5))
ax.grid()
ax.set_xlim(0, 10)
ax.set_ylim(0, 10)

# 指定した位置に注釈を入れる
ax.annotate("point A", xy=(4, 4), size=15,
            color="red", arrowprops=dict())

plt.show()
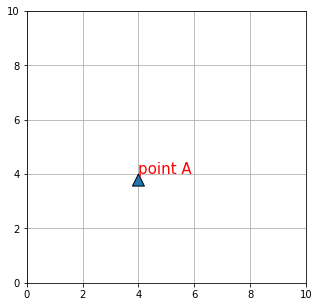
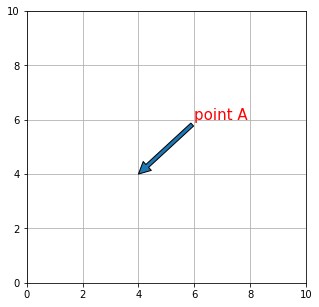
そこで、オプション引数 xytext に座標を指定して、注釈位置と矢印の始点をずらします。
# In[3]

fig, ax = plt.subplots(figsize=(5, 5))
ax.grid()
ax.set_xlim(0, 10)
ax.set_ylim(0, 10)

# 指定した位置に注釈と矢印を入れる
ax.annotate("point A", xy=(4, 4), size=15, xytext=(6, 6),
            color="red", arrowprops=dict())

plt.show()
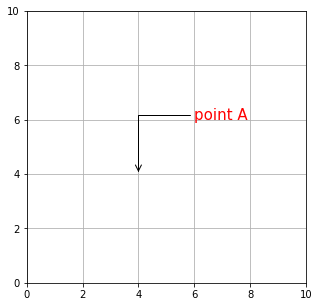
矢印のプロパティ
矢印のプロパティは arrowprops に渡す dict() の中で指定します。
# In[4]

fig, ax = plt.subplots(figsize=(5, 5))
ax.grid()
ax.set_xlim(0, 10)
ax.set_ylim(0, 10)

# 矢印のプロパティを設定
arrow_dict = dict(arrowstyle="->", color="black",
                  connectionstyle="angle, angleA=0, angleB=90")

# 指定した位置に注釈と矢印を入れる
ax.annotate("point A", xy=(4, 4), size=15, xytext=(6, 6),
            color="red", arrowprops=arrow_dict)

plt.show()
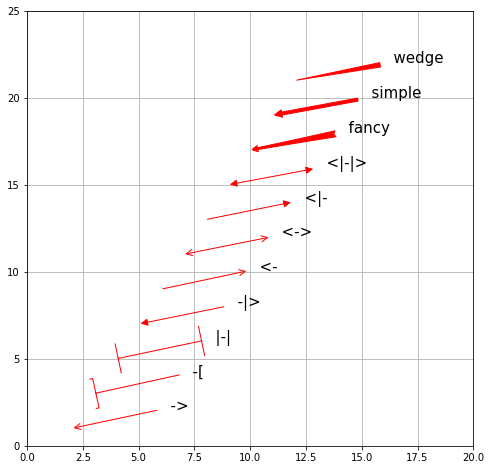
arrowstyle で矢印のスタイルを指定します。
# In[5]

fig, ax = plt.subplots(figsize=(8, 8))
ax.grid()
ax.set_xlim(0, 20)
ax.set_ylim(0, 25)

# arrow_styleのリスト
style_list = ["->", "-[", "|-|", "-|>", "<-", "<->",
              "<|-", "<|-|>", "fancy", "simple", "wedge"]

n = len(style_list)

# すべてのarrow_styleで矢印を描画
for k in range(n):
    arrow_dict = dict(arrowstyle=style_list[k], color="red")
    ax.annotate("  " + style_list[k], xy=(2 + k, 2 * k + 1),
                size=15, xytext=(6 + k, 2*k + 2),
                color="black", arrowprops=arrow_dict)

plt.show()
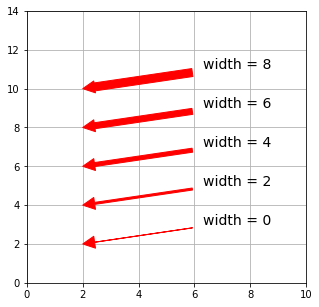
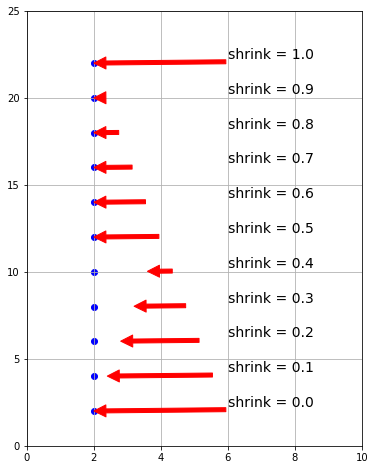
arrowprops に arrowstyle が指定されていなければ、以下の引数が有効になります。
| 引数 | 設定 |
|---|---|
| width | 矢印の太さ |
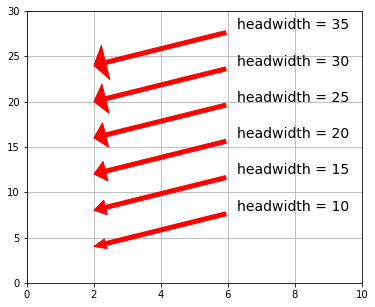
| headwidth | 矢印の先端の三角形の底辺の長さ |
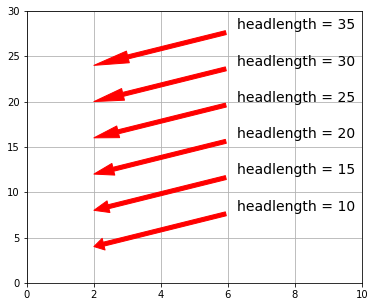
| headlength | 矢印の先端の三角形の高さ |
| shrink | 矢印を縮小する割合 |
矢印の始点と終点の経路は connectionstyle で制御します。
| 名前 | 属性 |
|---|---|
| angle | angleA = 90, angleB = 0 ,rad = 0.0 |
| angle3 | angleA = 90, angleB = 0 |
| arc | angleA = 0, angleB = 0, armA = None, armB = None, rad = 0.0 |
| arc3 | rad = 0.0 |
| bar | armA = 0.0, armB = 0.0, fraction = 0.3, angle = None |
connectionstyle の名前の後に属性を指定します。
属性を省略するとデフォルト値で経路が設定されます。
以下のコードを実行すると、すべての connectionstyle をデフォルト値で描きます。
# In[6]

fig, axs = plt.subplots(3, 2, figsize=(8, 8))

# 3行目2列目のAxesを非表示
axs[2,1].axis('off')

# connecitonstyleのリスト
cstyle_list = ["angle", "angle3", "arc", "arc3", "bar"]

n = len(cstyle_list)

# すべてのconnectionstyleを指定して矢印を描画
for ax, k in zip(axs.ravel(), range(n)):
    ax.grid()
    ax.set_xlim(0, 10)
    ax.set_ylim(0, 10)
    arrow_dict = dict(arrowstyle="->",
                      connectionstyle=cstyle_list[k], color="red")
    ax.annotate("  " + cstyle_list[k],
                xy=(2, 2), size=14, xytext=(6, 6),
                color="black", arrowprops=arrow_dict)

plt.show()
headwidth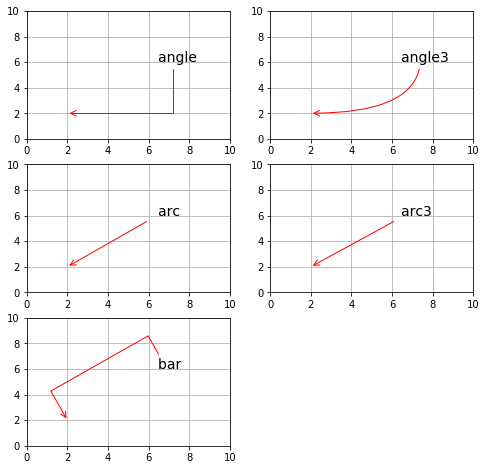
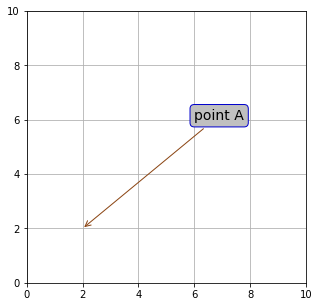
テキストボックスのプロパティ
Axes.annotate() の引数 bbox に dict() を渡して、テキストボックスの形状を設定することができます。詳細については bbox を参照してください。
# In[7]

fig, ax = plt.subplots(figsize=(5, 5))
ax.grid()
ax.set_xlim(0, 10)
ax.set_ylim(0, 10)

# 矢印のプロパティを設定
arrow_dict = dict(arrowstyle="->", color="saddlebrown")

# テキストボックスのプロパティ
# fc:facecolor, ec:edgecolor
text_dict = dict(boxstyle="round",
                 fc="silver", ec="mediumblue")

# 指定した位置に注釈と矢印を入れる
ax.annotate("point A", size=14, color = "black",
            xy=(2, 2), xytext=(6, 6),
            bbox=text_dict, arrowprops=arrow_dict)

#plt.show()
plt.show()
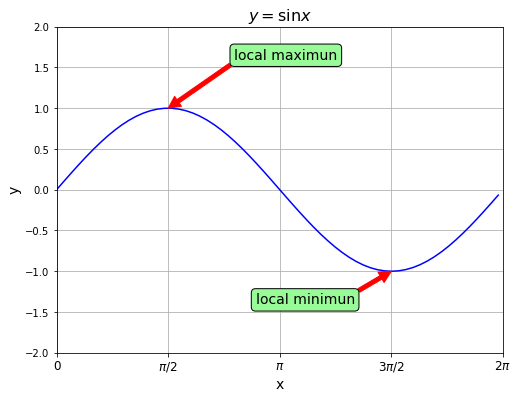
Axes.annotateの実践例
最後にAxes.annotate()メソッドの実践例を載せておきます。
# In[8]

# アノテーション(注釈)表記の実践例

# 円周率の略記
p = np.pi

# 0~2piまで0.1刻みの数値の配列を定義
x = np.arange(0, 2 * p, 0.1)

# グラフに描く関数
y = np.sin(x)

# FigureとAxesを作成
fig = plt.figure(figsize=(8, 6))
ax = fig.add_subplot(111)

# Axesのタイトル、グリッド、軸ラベル、軸範囲、目盛、目盛ラベルを設定
ax.set_title("$y=\sin x$", fontsize=16)
ax.grid()
ax.set_xlabel("x", fontsize=14)
ax.set_ylabel("y", fontsize=14)
ax.set_xlim(0.0, 2 * p)
ax.set_ylim(-2.0, 2.0)
ax.set_xticks([0, p/2, p, 3*p/2, 2*p])
ax.set_xticklabels(["0", "$\pi/2$", "$\pi$", "$3\pi/2$", "$2\pi$"],
                   fontsize=12)

# テキストボックスのプロパティを設定
text_dict = dict(boxstyle = "round", fc = "palegreen")

# 矢印のプロパティを設定
arrow_dict = dict(facecolor="red", edgecolor="red")

# 矢印とテキストを設定
ax.annotate("local maximun",
            xy=(p/2, 1), xytext=(2.5, 1.6),
            bbox=text_dict,
            arrowprops=arrow_dict, size = 14)

ax.annotate("local minimun",
            bbox=text_dict,
            xy=(3*p/2, -1), xytext=(2.8, -1.4),
            arrowprops=arrow_dict, size=14)

# Axesにグラフをプロット
ax.plot(x, y, color="blue")

plt.show()
コメント
下記は誤植と思われますので、ご確認ください。
「矢印のプロパティ」の引数と設定の表で、headwidth と headlength の説明が入れ替わっている。bbox のリンク先が張られていない。併せて connectionstyle のリンク先も張ってほしい。
今までプロット図の注釈には ax.text( ) しか使っていなかったので、ax.annotate( ) の「テキスト+矢印」の機能は、今後はぜひ活用したいと思いました。
bbox のリンクを貼り直しておきました。
connectionstyle に指定できる引数はこの記事の表に載っている 5 種類だけなので別記事はありません。申し訳ないです。
ax.annotate() はテキストと矢印の多彩な組み合わせを実現できるように設計されているので、ぜひ楽しんで活用してください!