
【Matplotlib】凡例(legend)の添付
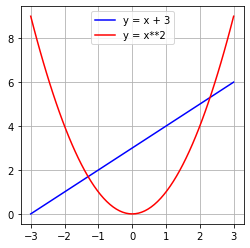
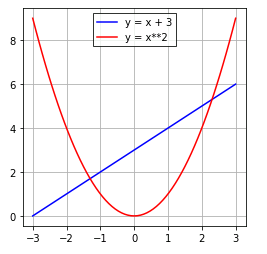
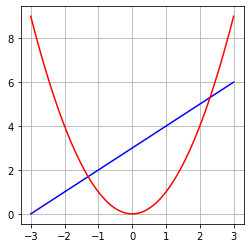
matplotlib.axes.Axes.legend() は Axes (サブプロット)に凡例を添えます。凡例とは、Axes.plot() などの描画メソッドで label に渡したテキストのことです。デフォルト設定ではグラフと重ならないように位置を自動調整して表示されます。
# MATPLOTLIB_AXES_LEGEND

# In[1]

import matplotlib.pyplot as plt
import numpy as np

# FigureとAxes
fig = plt.figure(figsize =(4, 4))
ax = fig.add_subplot(111)
ax.grid()

# データを作成
x = np.linspace(-3, 3, 65)
f = x + 3
g = x**2

# データをプロット
ax.plot(x, f, label="y = x + 3", color="blue")
ax.plot(x, g, label="y = x**2", color="red")

# 凡例を表示
ax.legend()
凡例の位置を指定する
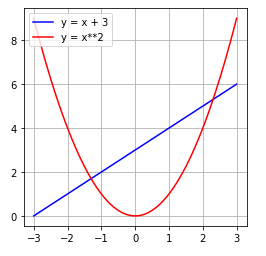
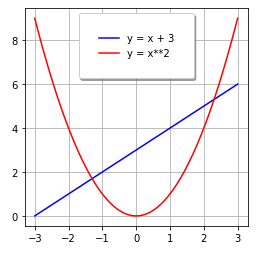
loc オプションで凡例の位置(location)を指定できます。たとえば、”upper left” を指定すると左上に凡例が表示されます。
# In[2]

# 凡例を左上隅に表示
ax.legend(loc="upper left")

# グラフを再表示
display(fig)
loc に指定可能な文字列とコードを表にまとめておきます。
| 文字列 | コード |
|---|---|
| best | 0 |
| upper right | 1 |
| upper left | 2 |
| lower left | 3 |
| lower right | 4 |
| right | 5 |
| center left | 6 |
| center right | 7 |
| lower center | 8 |
| upper center | 9 |
| center | 10 |
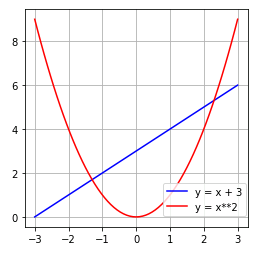
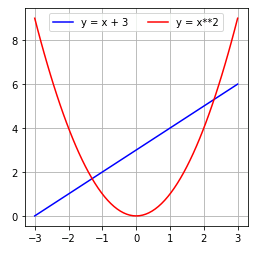
Axes の左下隅を (0, 0)、右上隅を (1, 1) とする float のタプルで位置を指定することもできます。
# In[3]

# 凡例の位置を指定
ax.legend(loc=(0.62, 0.05))

# グラフを再表示
display(fig)
凡例フレーム(角の丸め・枠線の色・影)
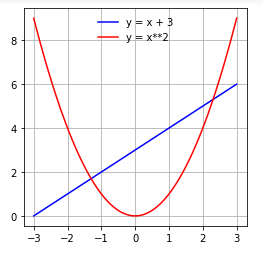
凡例フレームを表示しないときは frameon に False を指定します。
# In[4]

# 凡例フレームを表示しない
ax.legend(frameon=False)

# グラフを再表示
display(fig)
凡例フレームの角の丸めは fancybox、枠線の色は edgecolor で指定します。
# In[5]

# 凡例フレームの角を丸めない、枠線を黒にする
ax.legend(fancybox=False, edgecolor="black")

# グラフを再表示
display(fig)
borderpad は凡例フレームの余白、shadow は影の有無を指定する引数です。
# In[6]

# 凡例の余白を設定、影をつける
ax.legend(borderpad=2, shadow=True)

# グラフを再表示
display(fig)
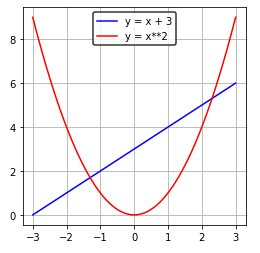
ncol で凡例の列数を指定できます。
# In[7]

# 凡例を2列で表示
ax.legend(ncol=2)

# グラフを再表示
display(fig)
枠線の太さを変えたいときは、get_frame().set_linewidth() メソッドを使います。
# In[8]

# 枠線の太さを設定
ax.legend(edgecolor="black").get_frame().set_linewidth(1.5)

# グラフを再表示
display(fig)
凡例の消去
凡例を消去したいときは、remove() メソッドを用います。
# In[9]

# 凡例を消去する
ax.get_legend().remove()

display(fig)
凡例の実践例
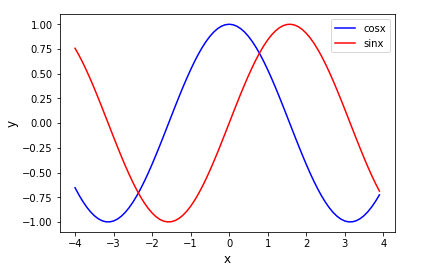
1 枚のサブプロットに sinx と cosx をプロットして凡例を添えるサンプルコードを載せておきます。
# MATPLOTLIB_LEGEND_SIN_COS

# In[1]

import numpy as np
import matplotlib.pyplot as plt

# FigureとAxes
fig = plt.figure()
ax = fig.add_subplot(111)

# xのデータを作成
x = np.arange(-4, 4, 0.1)

# yのデータを作成
f = np.cos(x)
g = np.sin(x)

# 軸ラベルの設定
ax.set_xlabel("x", size=12)
ax.set_ylabel("y", size=12)

# データをプロット
ax.plot(x, f, color="blue", label="cosx")
ax.plot(x, g, color="red", label="sinx")

# 凡例の設定
ax.legend(loc="upper right")
関連記事:【Matplotlib】タイトルの設定
関連記事:【Matplotlib】テキストの表示と書式設定
コメント
下記は誤植と追われますので、ご確認ください。
In[1]プログラムで、label=”y = x**2″ → label=”y = x + 3″
label=”y = x**3″ → label=”y = x**2″
ありがとうございます。
直しておきました。m(_ _)m